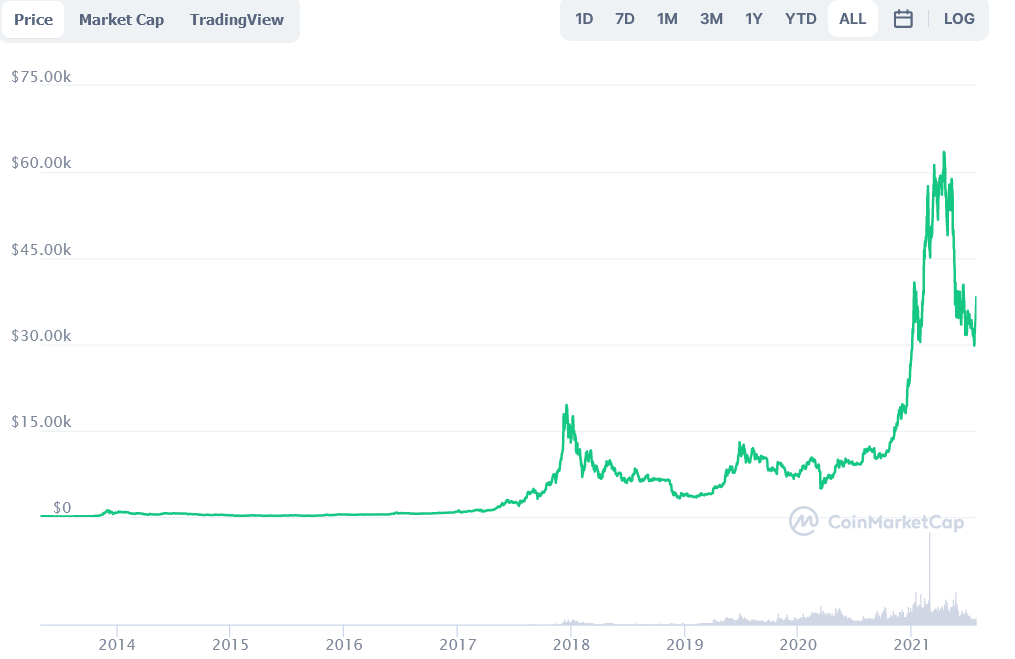
Bitcoin (BTC) began the week of July 19-25 with a downward trend that ended on July 20 with a low of $29,278. BTC increased slightly the next day after the bullish engulfing candlestick on July 21, creating another small bullish candlestick. However, since then, the price has risen, reclaimed the $38k price level by moving above $31,300 horizontal support area
BTC bullish outlook daily chart
On the daily chart, the outlook is more bullish. The decrease of 20 July was only a deviation, since shortly after, BTC recovered the $31,300 horizontal area. It then began a rapid upward movement, resulting in the formation of six consecutive bullish candlesticks.
So far, it’s hit a high of $39,799, just shy of the range high of $40,500. Technical indicators are pointing to a bullish outcome. The RSI has risen above 50, and the Stochastic oscillator is on the verge of crossing to the upside. Furthermore, even though the signal line is not yet positive, the MACD is moving upwards. The top of this move is most likely to be between $42,181 and $42,435.
BTC could rise to a price of $50,218 to $50,986 in the future. This would result in a 1:2.61 ratio between waves A and C, reaching the 0.618 Fib retracement resistance level. Following this, BTC is expected to fall once more.
Bitcoin price movement
Bitcoin is ranked 1st cryptocurrency whose coin’s value at the time of writing is $38,240.11 with the change of 10.72%. BTC trading volume in the last 24 hours is $37,107,181,643 along with market cap of $717,597,334,096.

BTC is still above the $27,050 0.618 Fib retracement support level. Despite this, technical indicators on a weekly basis remain bearish.
The MACD is currently negative and falling and the RSI has dropped below 5, and the Stochastic oscillator has crossed to the downside. As a result, the long-term trend is likely to remain bearish.
BTC is approaching the range highs of $40,550, and a break above that level could allow the sharp upward trend to continue.
Credit: Source link


